Important note: Each investor has their own performance based on the amount invested, the tilts and the screens chosen. The figures below are the returns for indicative portfolios without any screens or tilts.
Click here for full performance reports.
These are the higher growth portfolios. While we expect higher returns over time, they are higher risk and likely to be more volatile.
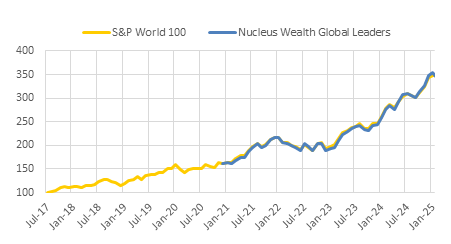
| Period | Return |
|---|---|
| 1m | 0.2% |
| 3m | 4.5% |
| 1y | 15.8% |
| 3y | 22.8% p.a. |
| Incept. | 18.6% p.a. |
Return to 30 Nov 2025
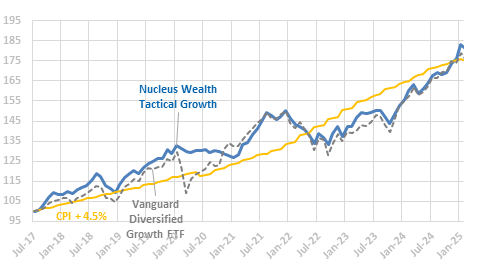
| Period | Return |
|---|---|
| 1m | 0.6% |
| 3m | 2.1% |
| 1y | 11.7% |
| 3y | 10.8% p.a. |
| Incept. | 8.2% p.a. |
Return to 30 Nov 2025
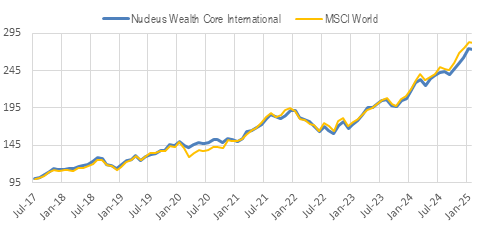
| Period | Return |
|---|---|
| 1m | 0% |
| 3m | 3.6% |
| 1y | 19.9% |
| 3y | 19.8% p.a. |
| Incept. | 14% p.a. |
Return to 30 Nov 2025
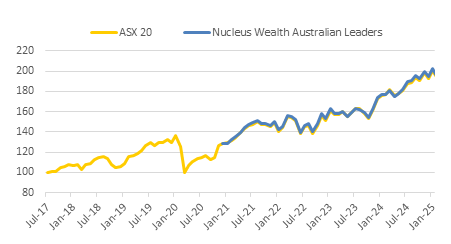
| Period | Return |
|---|---|
| 1m | -6% |
| 3m | -5.8% |
| 1y | 0.9% |
| 3y | 8.4% p.a. |
| Incept. | 9.6% p.a. |
Return to 30 Nov 2025
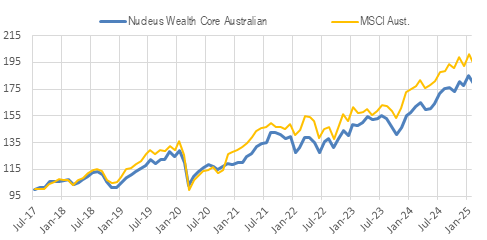
| Period | Return |
|---|---|
| 1m | 1.4% |
| 3m | 0.2% |
| 1y | 8.8% |
| 3y | 10.8% p.a. |
| Incept. | 8.4% p.a. |
Return to 30 Nov 2025
These are the defensive portfolios. They are considerably less volatile than the growth portfolios.
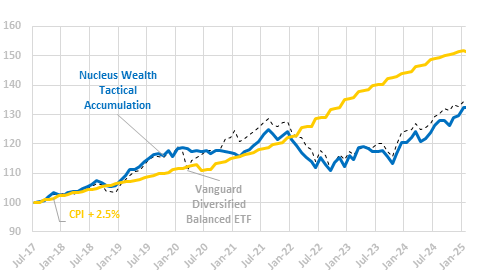
| Period | Return |
|---|---|
| 1m | 0.3% |
| 3m | 1% |
| 1y | 7.9% |
| 3y | 6.3% p.a. |
| Incept. | 4% p.a. |
Return to 30 Nov 2025
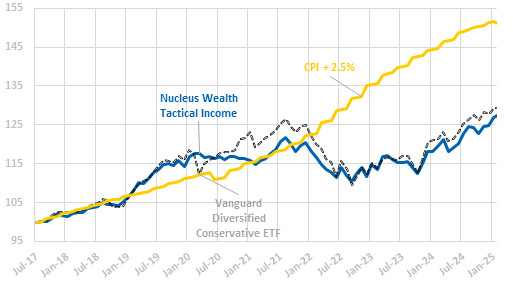
| Period | Return |
|---|---|
| 1m | 1.1% |
| 3m | 1.2% |
| 1y | 6.9% |
| 3y | 5.3% p.a. |
| Incept. | 3.5% p.a. |
Return to 30 Nov 2025
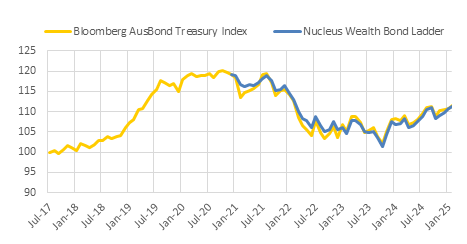
| Period | Return |
|---|---|
| 1m | -1.3% |
| 3m | -0.9% |
| 1y | 3.9% |
| 3y | 1.8% p.a. |
| Incept. | -1% p.a. |
Return to 30 Nov 2025